Financial Highlights
| FY 2019 ended March |
FY 2020 ended March |
FY 2021 ended March |
FY 2022 ended March |
FY 2023 ended March |
|
|---|---|---|---|---|---|
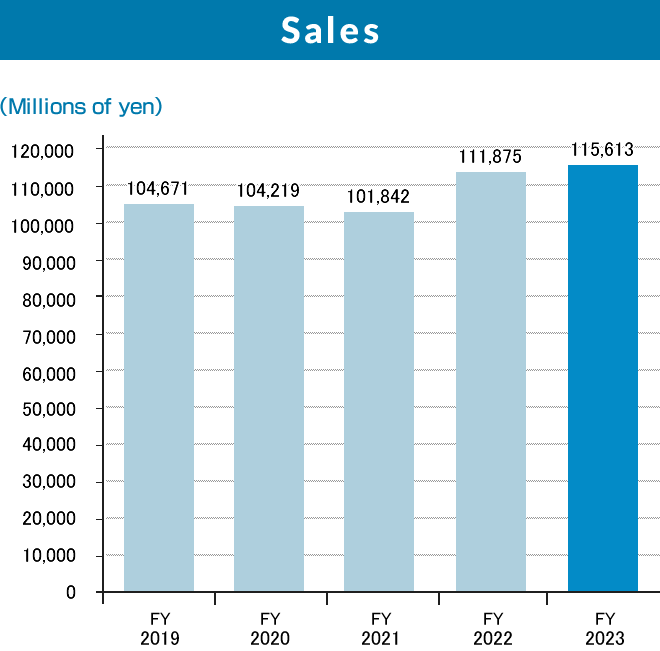
| Sales (Millions of Yen) |
104,671 | 104,219 | 101,842 | 111,875 | 115,613 |
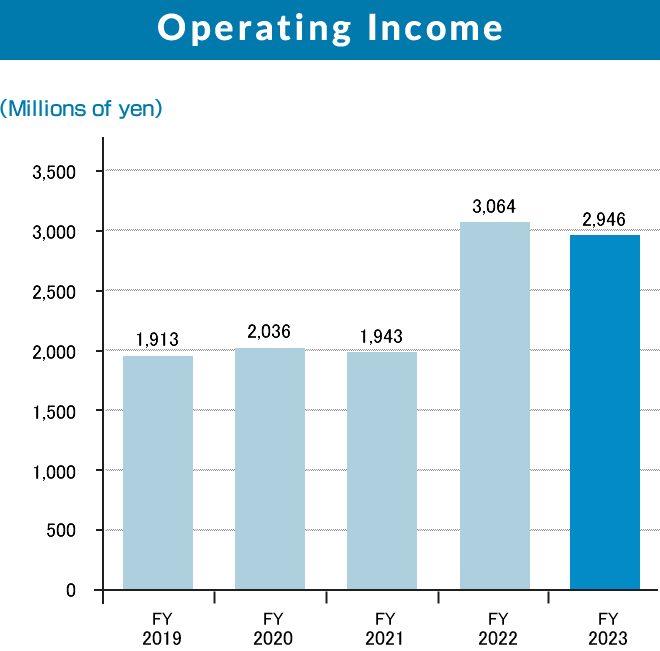
| Operating income (Millions of Yen) |
1,913 | 2,036 | 1,943 | 3,064 | 2,946 |
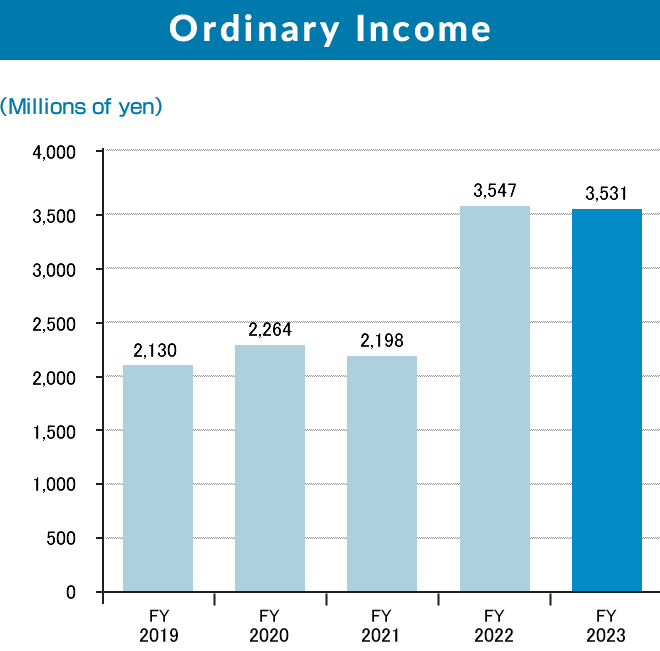
| Ordinary income (Millions of Yen) |
2,130 | 2,264 | 2,198 | 3,547 | 3,531 |
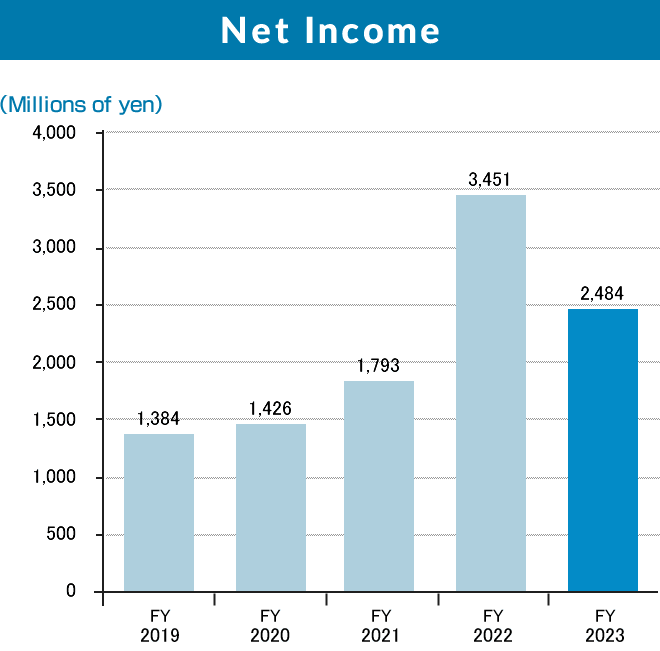
| Net income (Millions of Yen) |
1,384 | 1,426 | 1,793 | 3,451 | 2,484 |
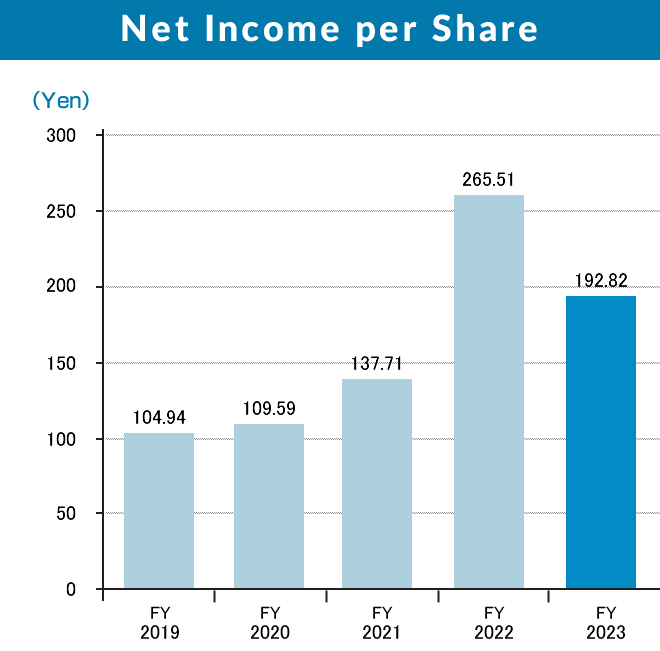
| Net income per share (Yen) |
104.94 | 109.59 | 137.71 | 265.51 | 192.82 |
| FY 2019 ended March |
FY 2020 ended March |
FY 2021 ended March |
FY 2022 ended March |
FY 2023 ended March |
|
|---|---|---|---|---|---|
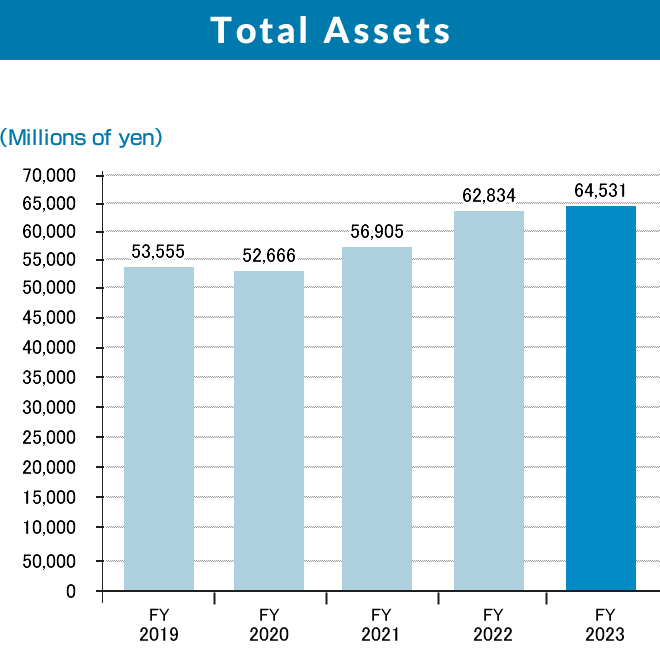
| Total assets (Millions of Yen) |
53,555 | 52,666 | 56,905 | 62,834 | 64,531 |
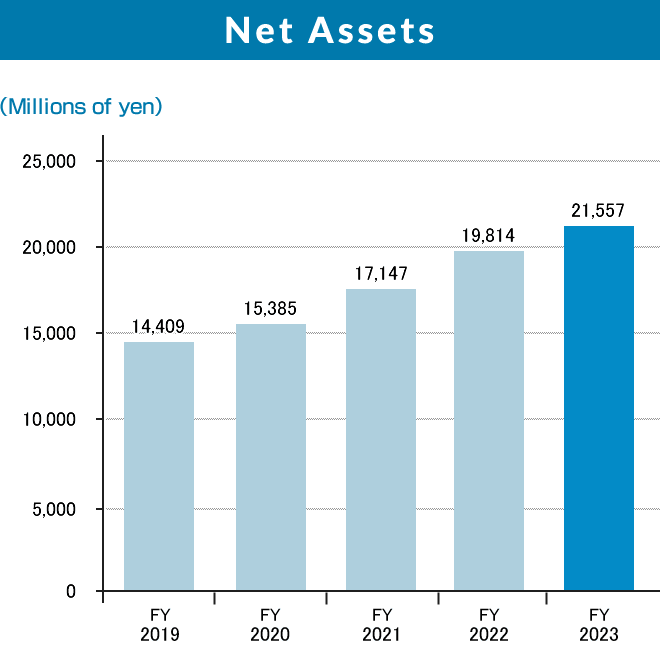
| Net assets (Millions of Yen) |
14,409 | 15,385 | 17,147 | 19,814 | 21,557 |
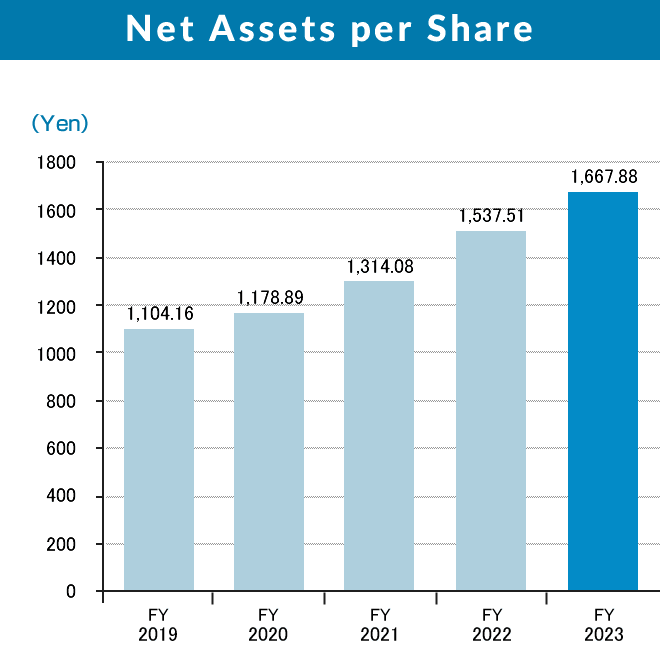
| Net assets per share (Yen) |
1,104.16 | 1,178.89 | 1,314.08 | 1,537.51 | 1,667.88 |
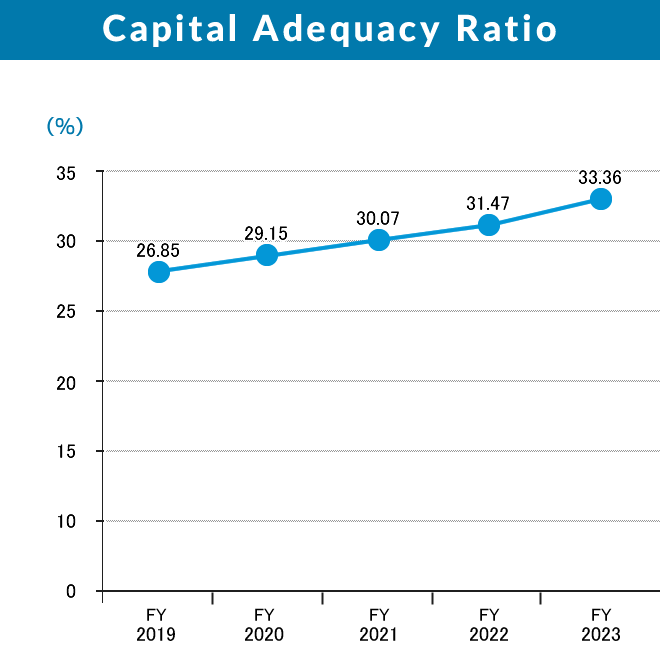
| Capital adequacy ratio (%) |
26.85 | 29.15 | 30.07 | 31.47 | 33.36 |


